Police Violence and Protests in the United States (2013-2020)
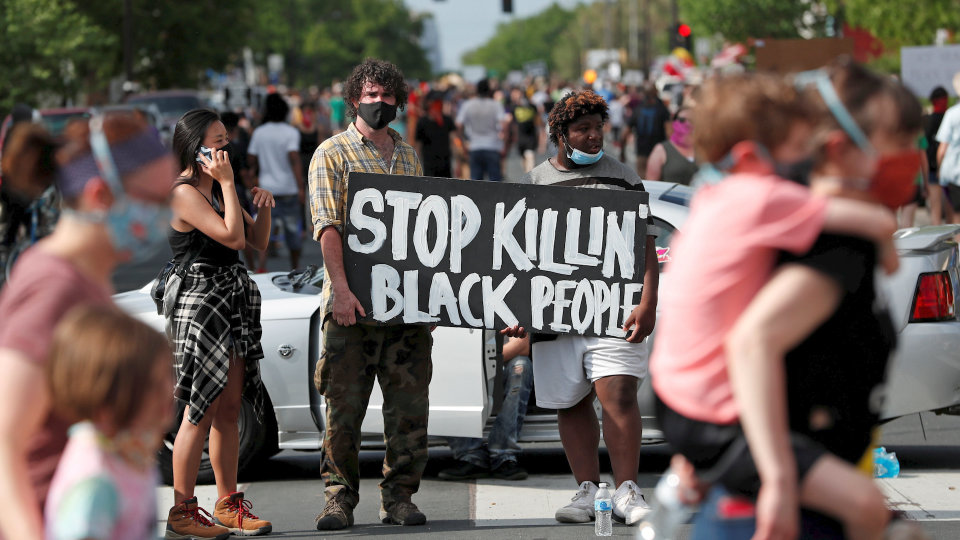
Image source: Wall Street Journal
About the Project
This project is motivated by the killing of George Floyd and the protests that followed in the United States, through the summer and fall of 2020. This project will look broadly at police violence in the United States through analysis of data on individuals killed by police from 2013 to 2020, and will also focus specifically on the Black Lives Matter protests that have occurred in 2020. This project is ultimately being completed to assess the instances of excessive use of force by police and to determine whether instances of excessive force are concentrated demographically and geographically.
We focus primarily on communicating information through visualizations (such as interactive maps, static maps, and graphs). Regression analyses (logistic, Poisson and negative binomial) are available to further explore significant associations within the datasets.
Website Overview
Data for this project was acquired from the Mapping Police Violence group for data on police violence in the United States, the ACLED US Crisis Monitor for data on 2020 Black Lives Matter protests in the United States, the American Community Survey for data on race and income by county, and the US Census for information on overall population breakdown by race.
In the Exploratory Analyses tab, you will find:- Analyses of mapping police violence data, through visualizations,
- Analyses of protest data, through visualizations; and,
- Logistic analyses investigating police violence data through charges laid against police and reported symptoms of mental illness as outcomes; and,
- Poisson and negative binomial models investigating associations between income at the county-level and number of protests per county.
The interactive maps tab will lead you to a dashboard that includes interactive maps and plots that will change depending on your selection. From here, you can explore instances of police violence and protests held over time geographically.
Additional Information
- Visit the Project Report tab in the upper right of the website for a full page write-up on what was done from start to finish in this project; and
- Visit our project Youtube video, linked in the upper right corner of the website, for a brief introduction and overview of the project.
Collaborators: